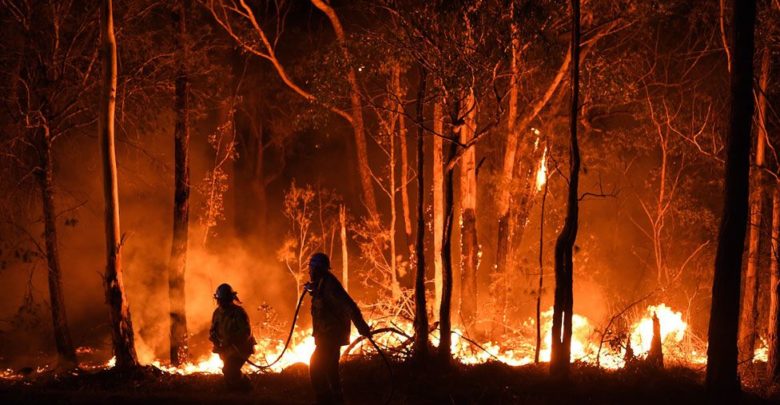
Record-breaking temperatures and months of severe drought have fuelled a series of massive bushfires across Australia.
The fires, burning since September, have intensified over the past week, with a number towns evacuated. High temperatures and strong winds are forecast for the weekend, creating further fire risk.
Twenty people have so far been killed – including three volunteer firefighters – and about six million hectares (60,000 sq km or 14.8 million acres) of bush, forest and parks have been burned.

Source: Nasa Firms. Map built using Carto
If you can’t see the map click here.
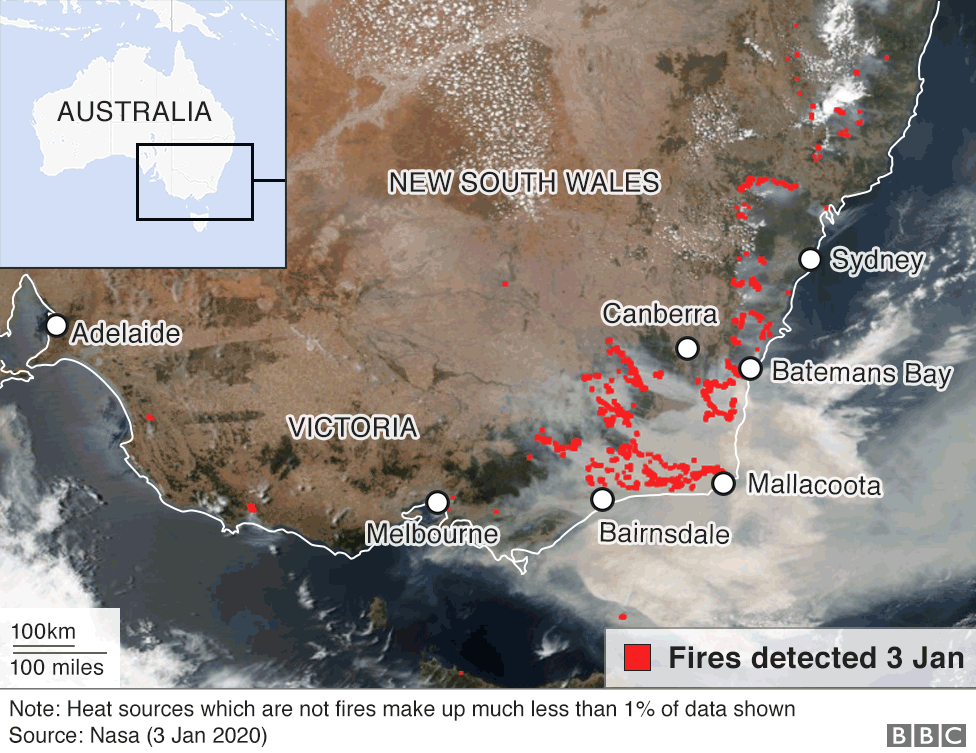
New South Wales has been worst affected
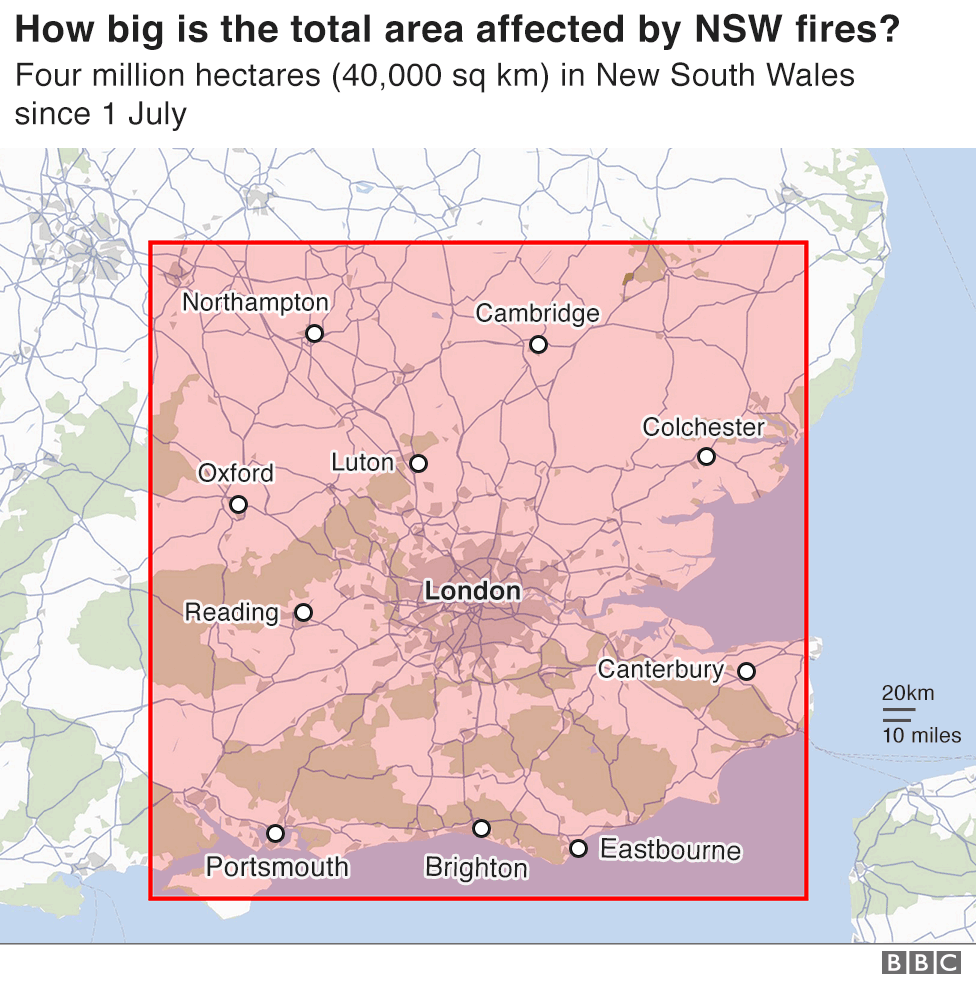
In the worst-hit state, New South Wales (NSW), fire has affected more than four million hectares, destroying more than 1,300 houses and forcing thousands to seek shelter elsewhere.
Hot, dry weather combined with prolonged drought and strong winds have created perfect conditions for fire to spread rapidly.
More than 130 fires were burning across the state on Friday, in the bush, mountain forests and national parks, with about 60 still not contained by firefighters and posing a risk to lives.
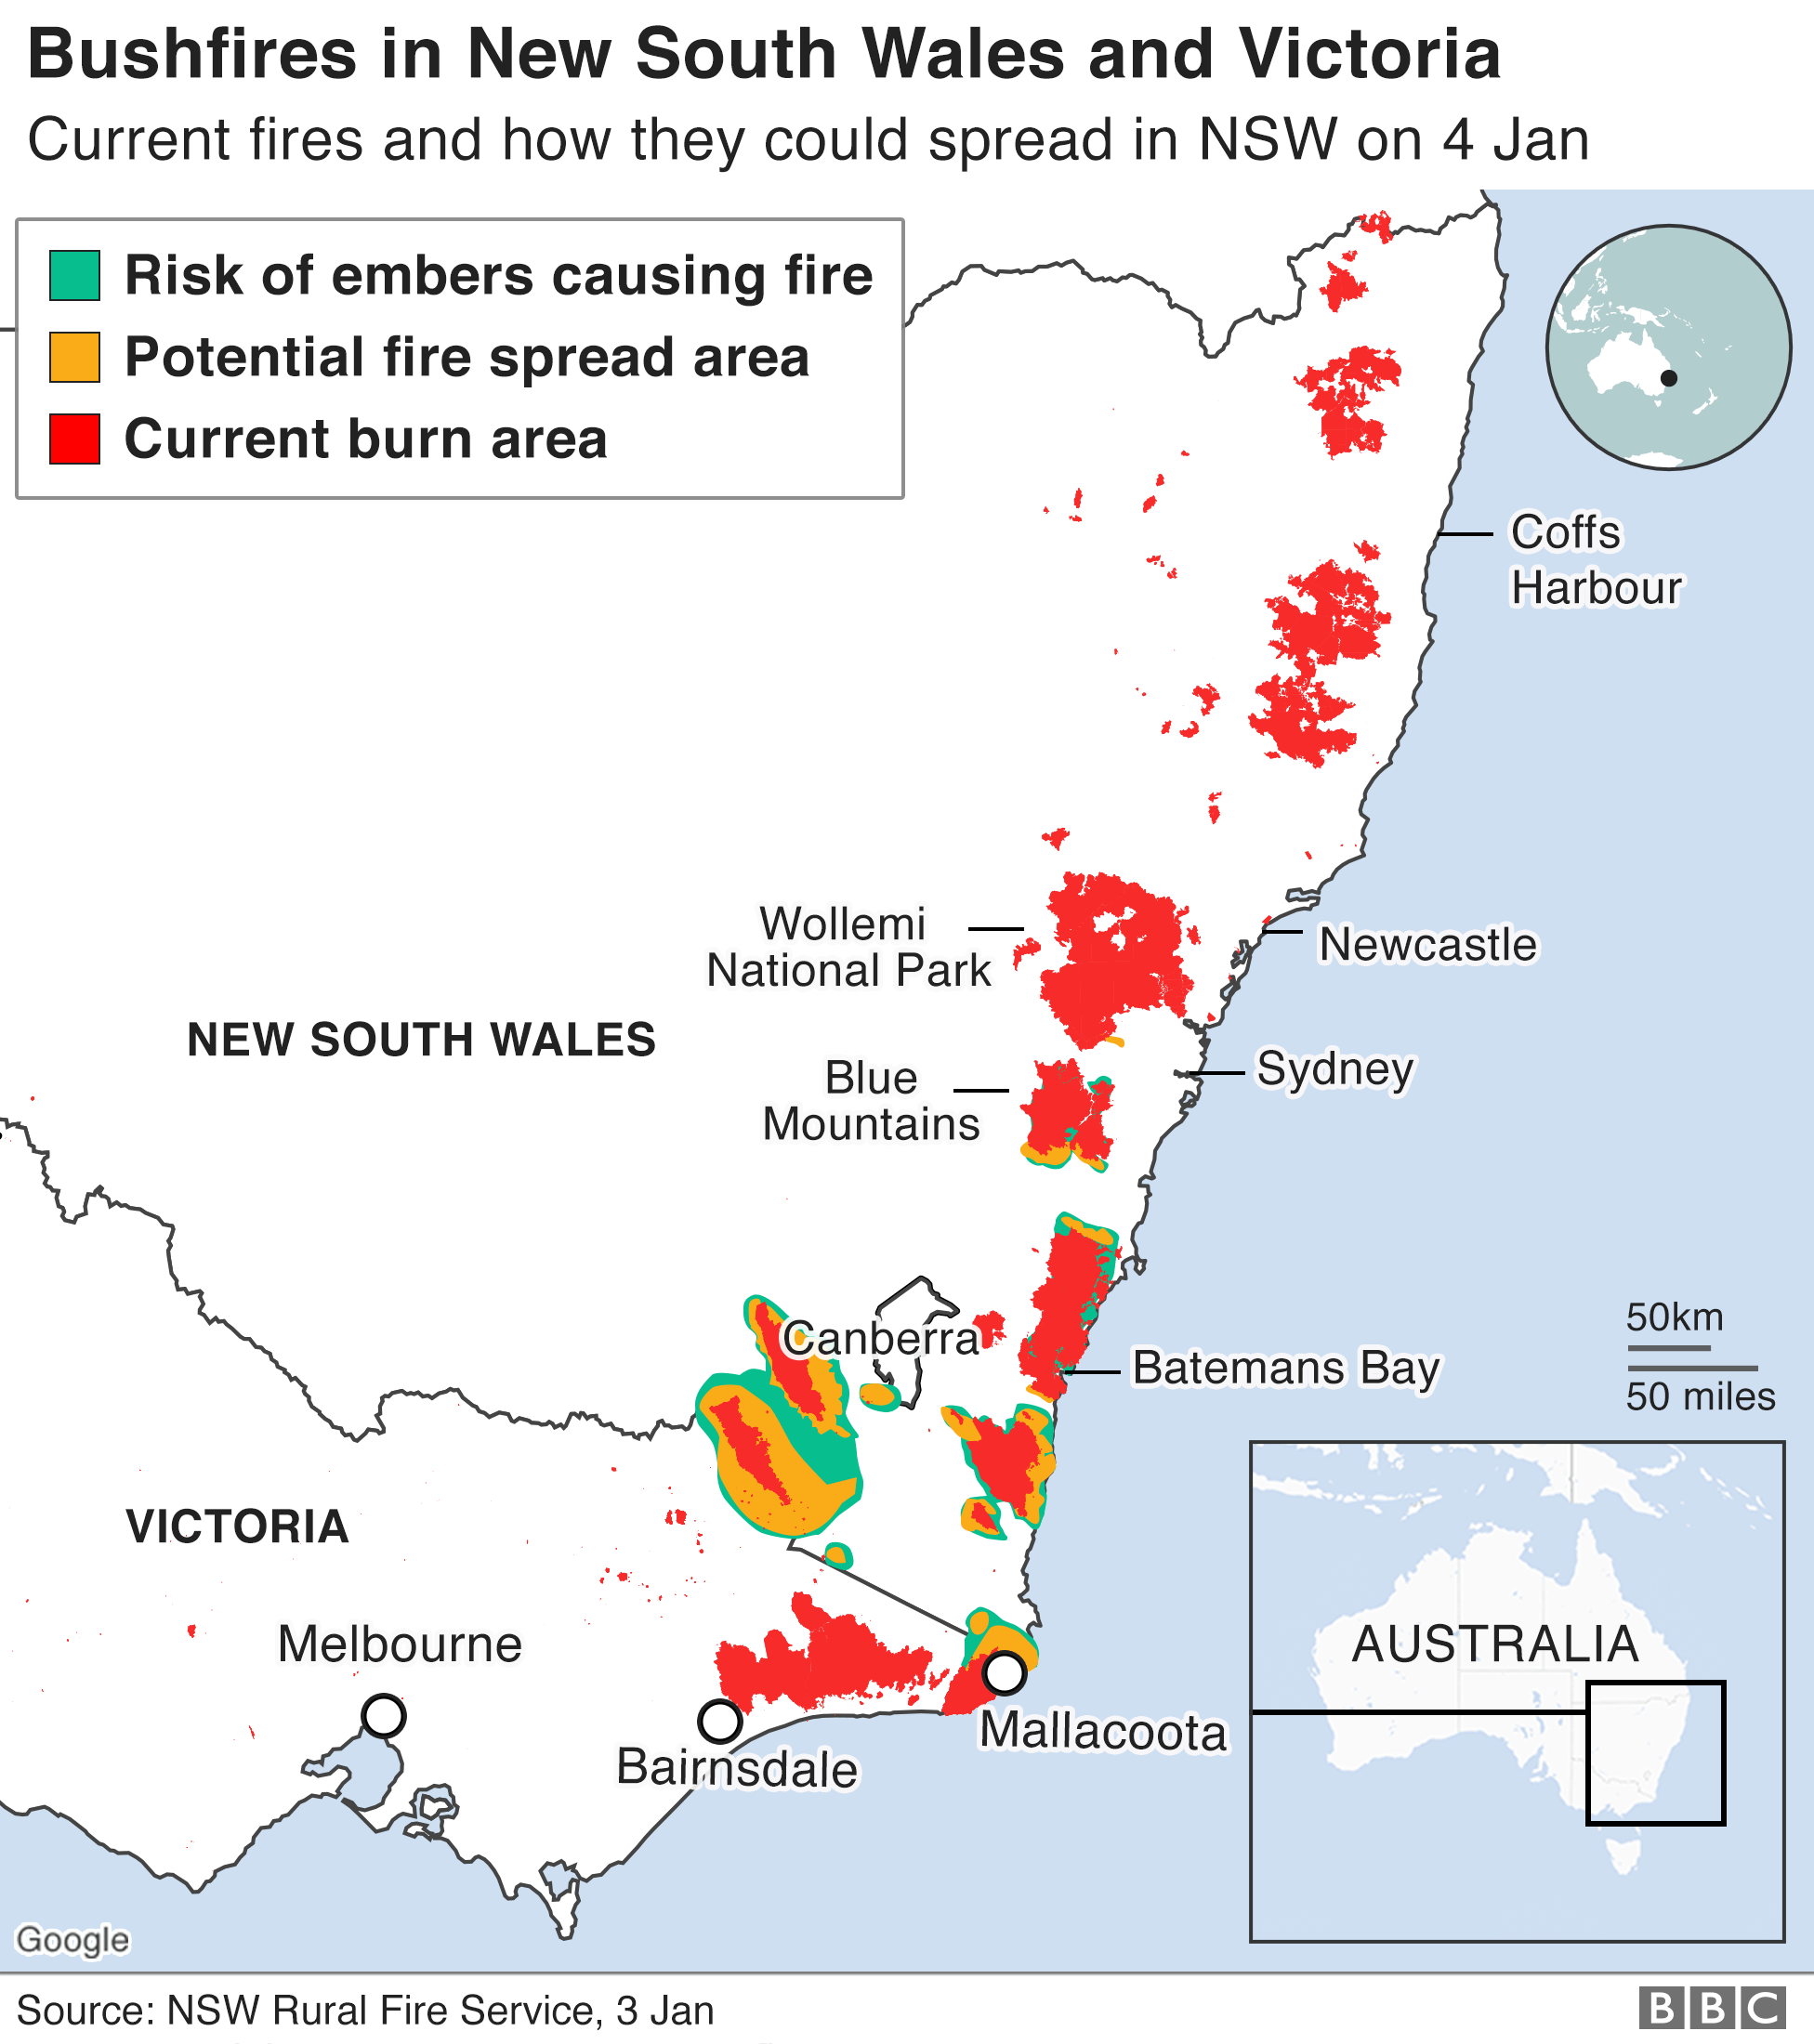

The fires have been exacerbated by 40C temperatures and strong winds, creating difficult conditions for the thousands of firefighters deployed in the field.
The small town of Balmoral, south-west of Sydney, was largely destroyed and scores of homes were razed amid catastrophic conditions on 22 December.
But conditions are still dangerous and a state of emergency for NSW has come into force. Parks, trails and camping grounds have been closed and holidaymakers have been told to urgently leave a 260km (160-mile) stretch of NSW coast before Saturday, 4 January, when extreme conditions are forecast.

Other states are also suffering
In Victoria, more than 800,000 hectares have been burned. Fires have been burning since late November but the have caused devastation in recent days, leaving two people dead and destroying around 43 homes in East Gippsland.
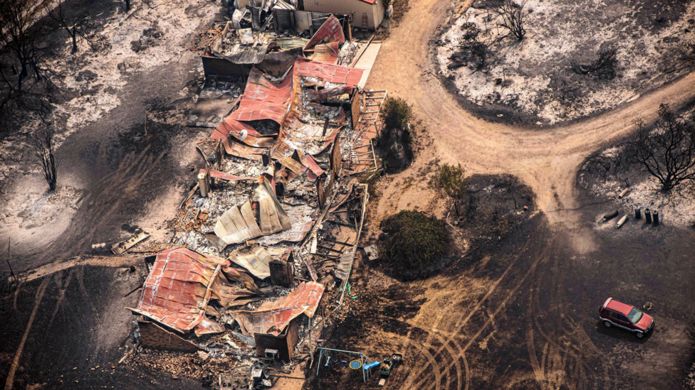 Image copyrightEPA
In the small town of Mallacoota, residents fled to the beach on 31 December, with only a change in the wind direction keeping the fire from reaching them on the shore.
Around 1,000 tourists and residents were eventually evacuated by the Australian navy and taken further down the coast.
The military has sent troops, ships and aircraft to the region to help relocation and firefighting efforts.
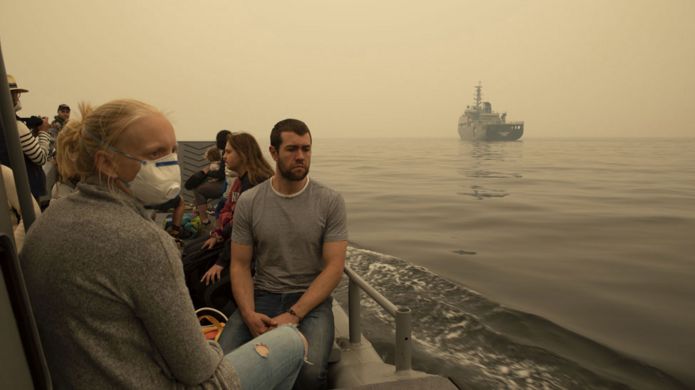 Image copyrightEPA/ROYAL AUSTRALIAN NAVY
A state of disaster has been declared for the worst-hit areas in Victoria, which allows the authorities to enforce evacuations and let emergency services take over properties.
Satellite images show the spread of smoke from fires in Victoria and NSW, which has affected air quality as far away as New Zealand.

In the state of South Australia, the Cudlee Creek fire is reported to have destroyed more than 80 homes in the Adelaide Hills region.
The fires are also thought to have destroyed up to a third of the vines that provide grapes for the Adelaide Hills wine industry.
In the Australian capital Canberra – an administrative region surrounded by NSW – bushfire smoke meant air quality there was rated the third worst of all major global cities on Friday, according to Swiss-based group AirVisual.
Very hot and dry conditions, with strong winds and thunderstorms are expected – posing further fire risk.

The fires have been worse than usual
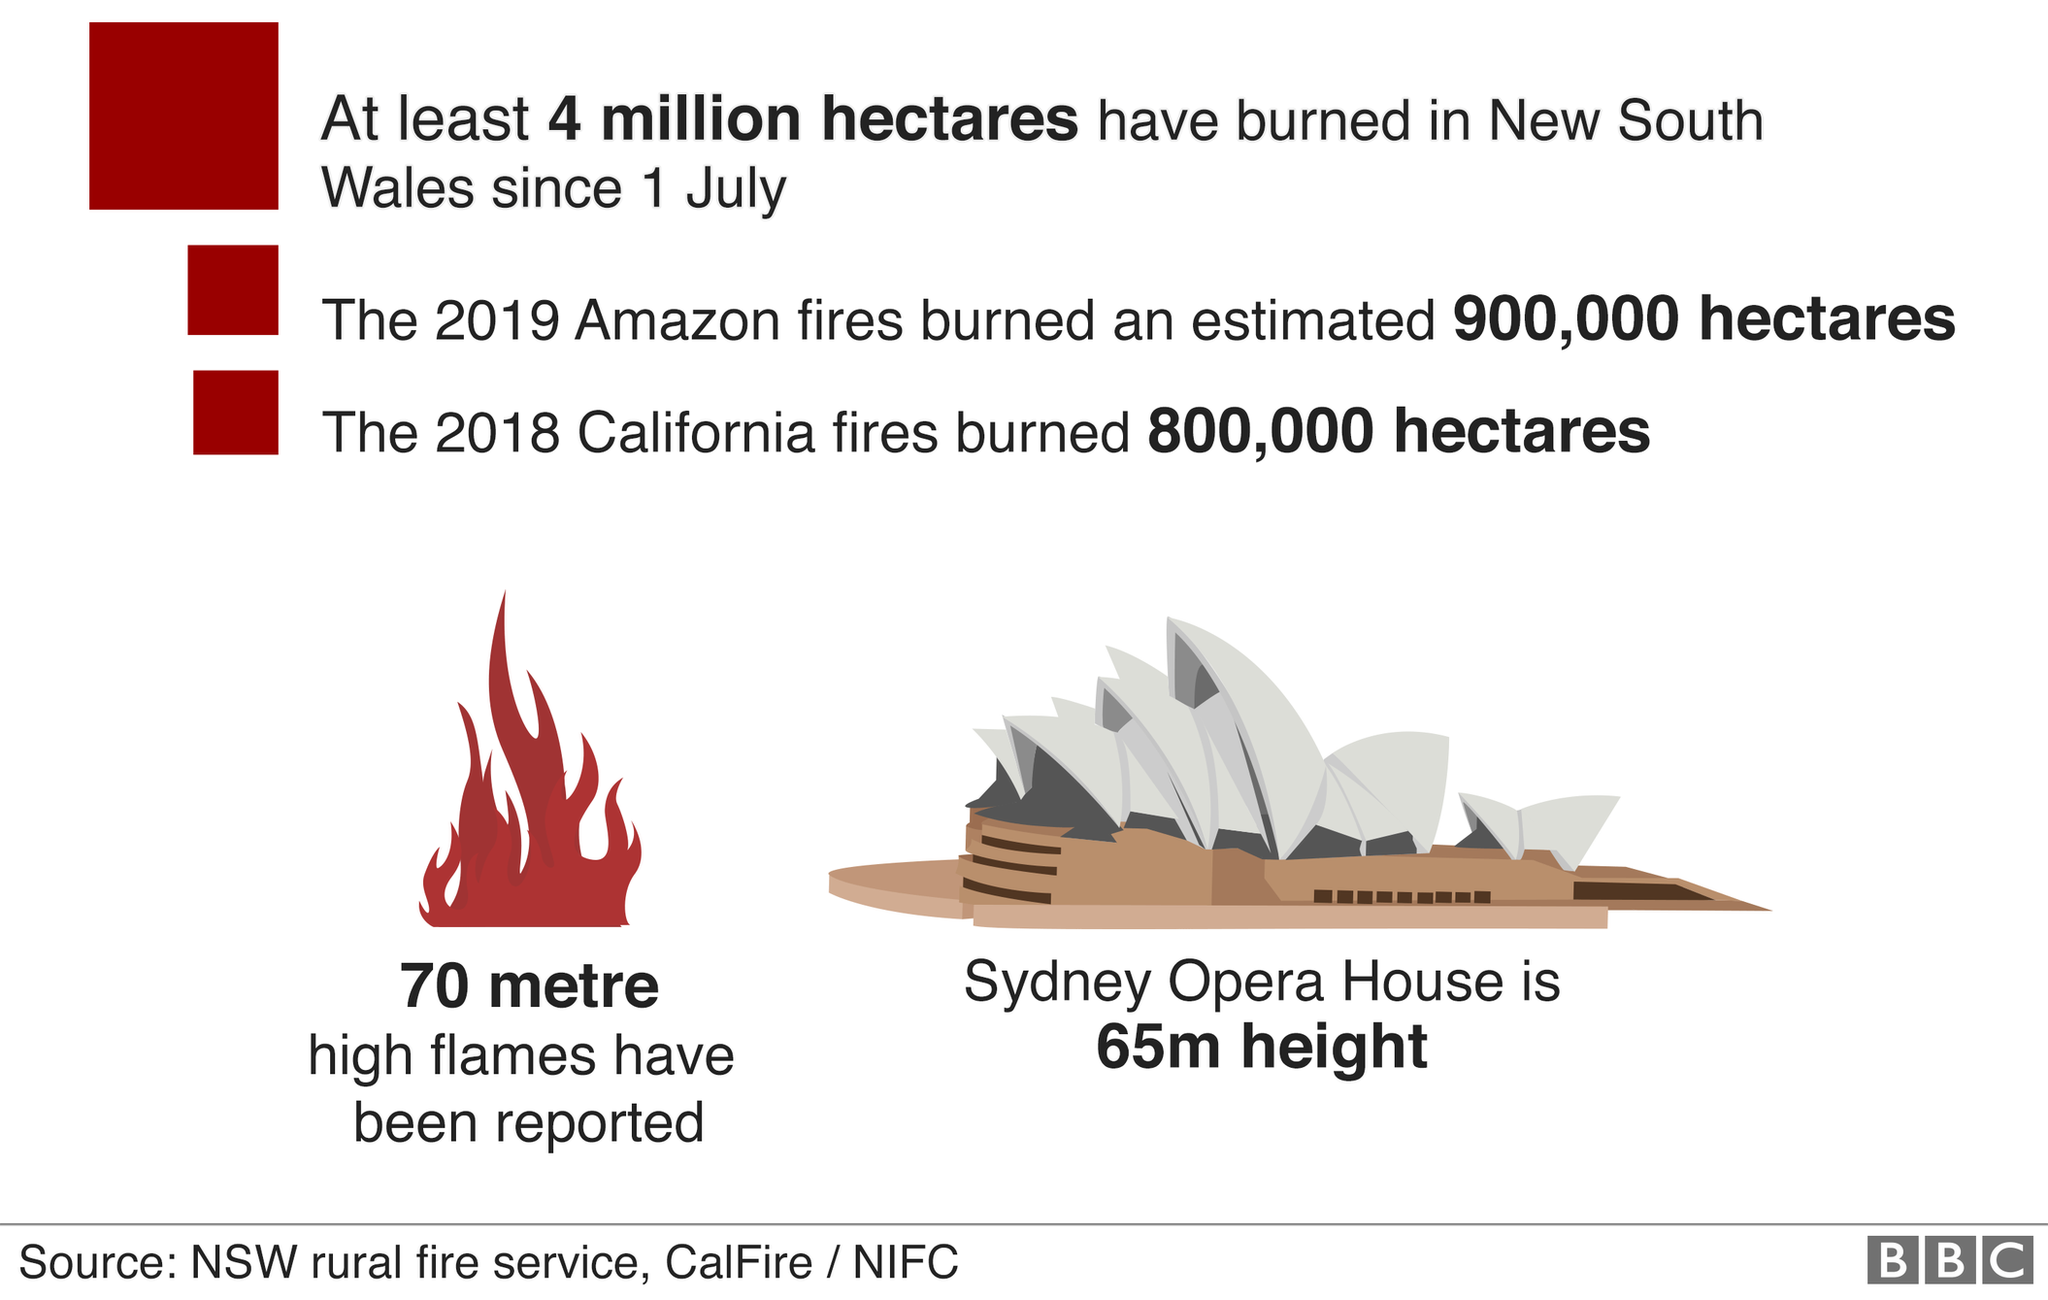
To put the fire damage in New South Wales in perspective, some 900,000 hectares were lost in the 2019 Amazon fires and around 800,000 hectares burned in the 2018 California wildfires.
The total area of land affected by the NSW fires would cover most of the south of England.
Although Australia has always had bushfires, this season has been a lot worse than normal.
Humans are sometimes to blame for starting the fires, but they are also often sparked by natural causes, such as lightning striking dry vegetation.
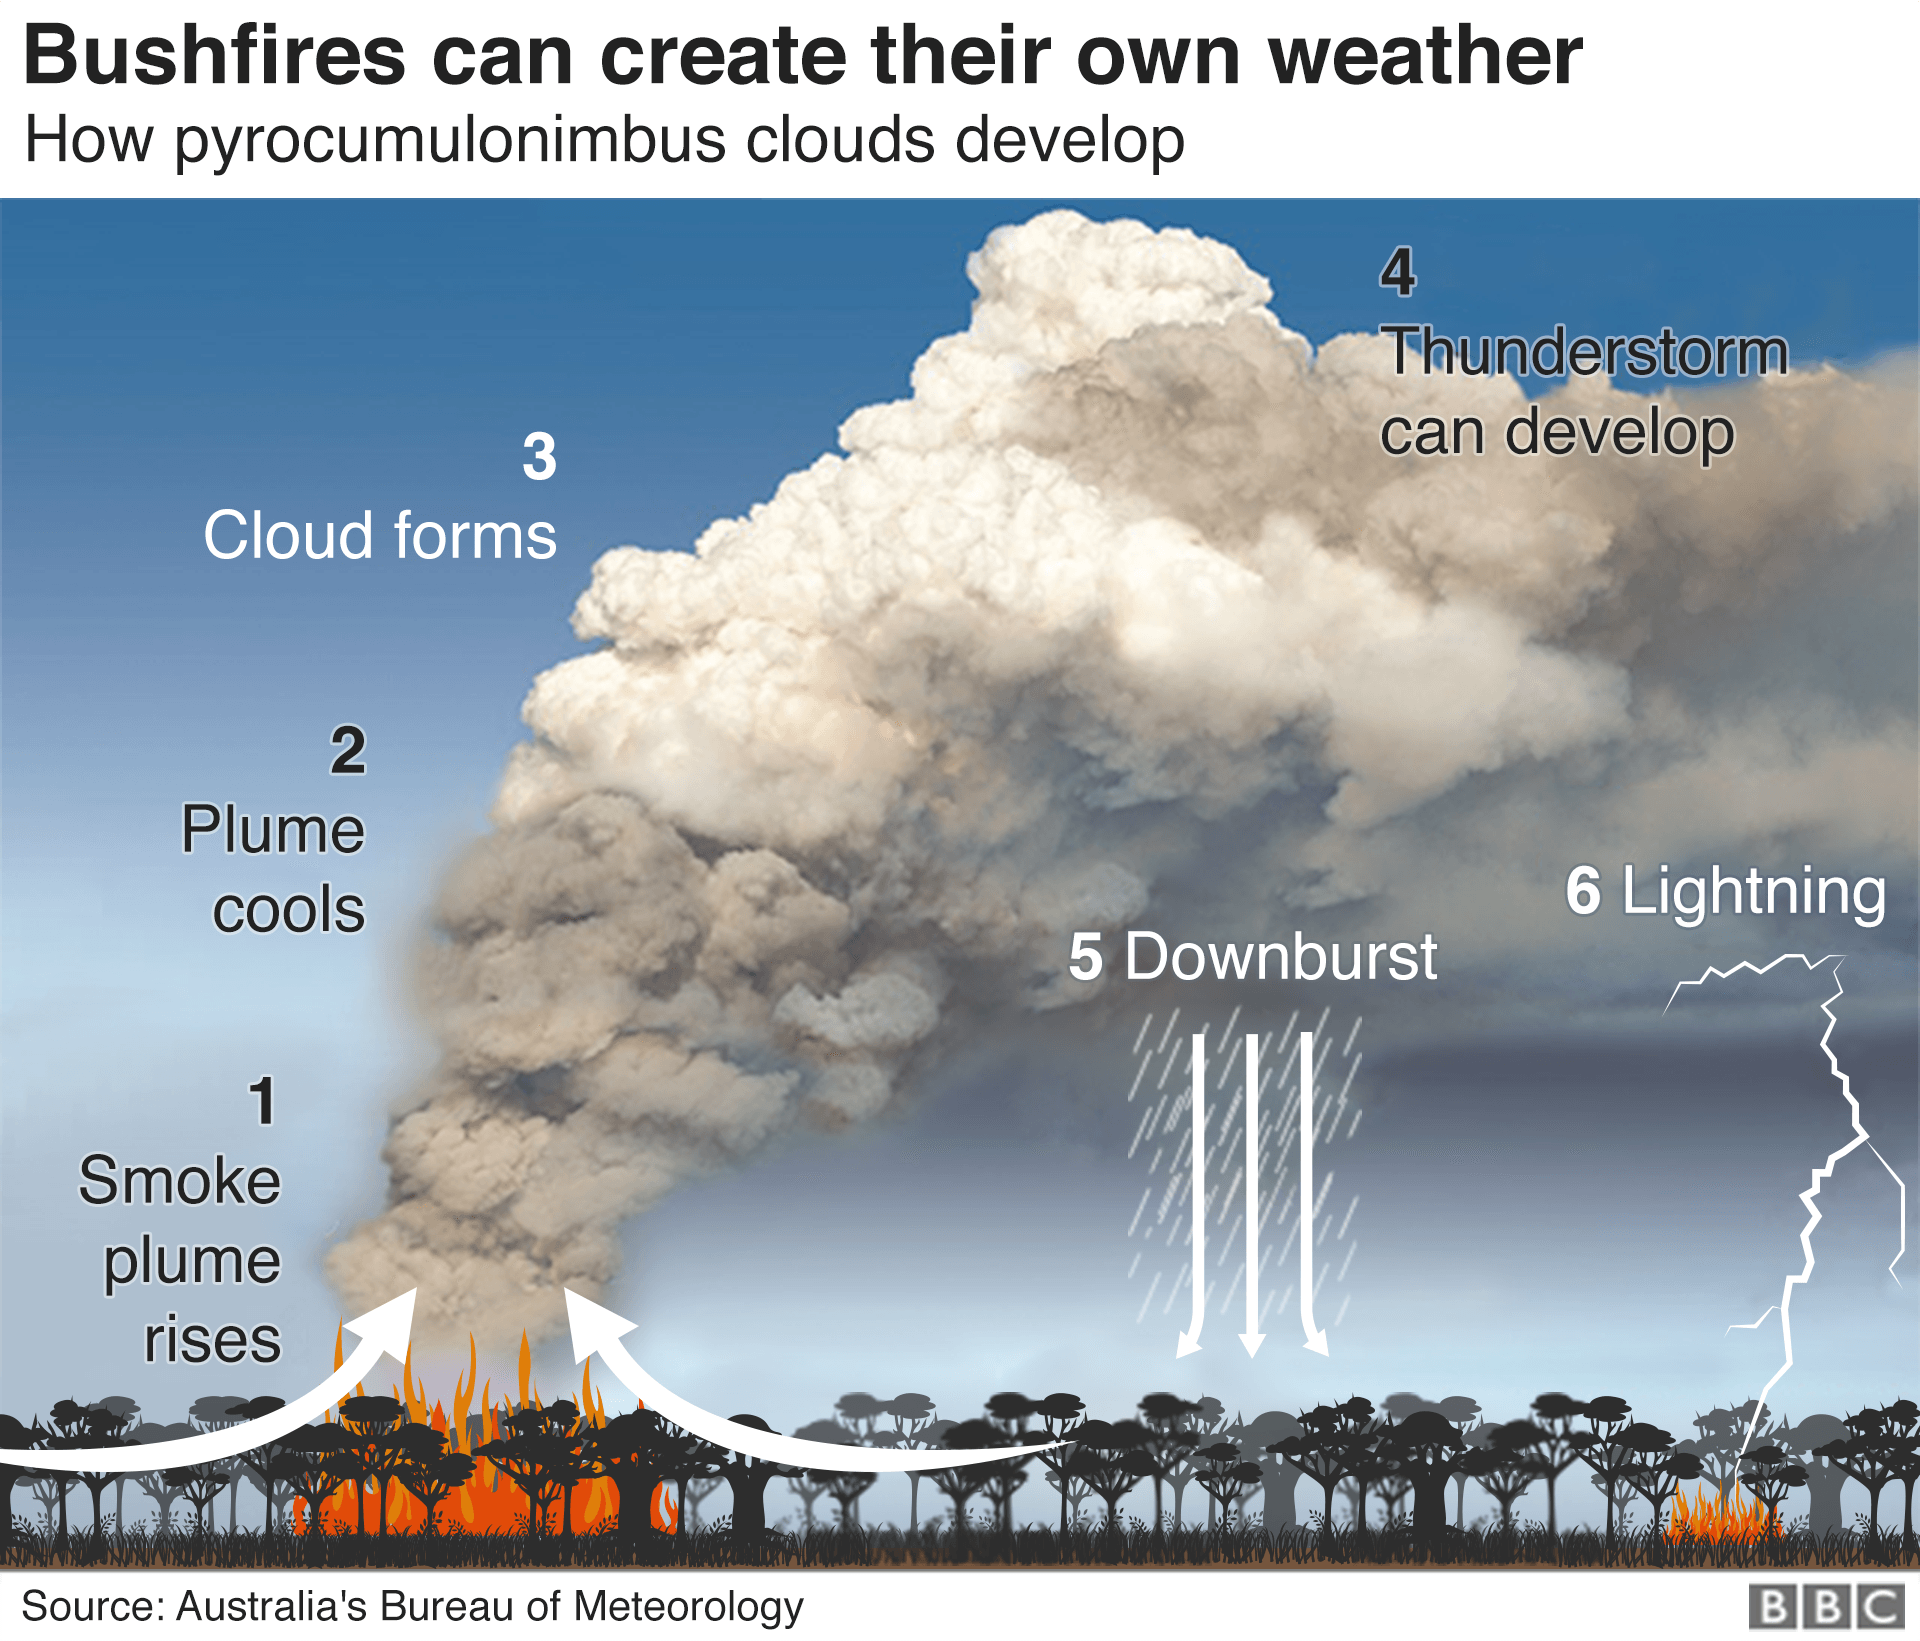
Once fires have started, other areas are at risk, with embers blown by the wind causing blazes to spread to new areas.
Bush fires themselves can also drive thunderstorms, increasing the risk of lightning strikes and further fires.
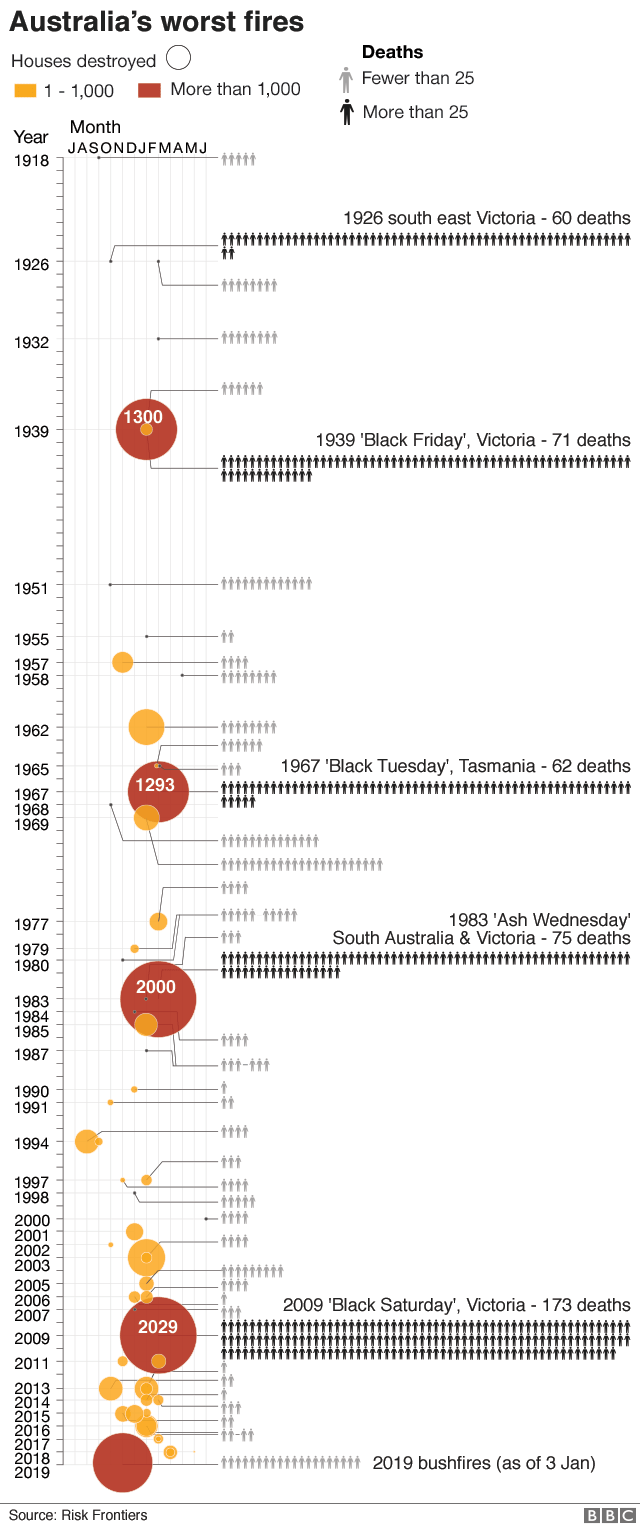
The number of people killed as a result of the fires since September 2019 is higher than in recent years.
Australia’s deadliest bushfire disaster was “Black Saturday” in February 2009, when some 180 people died in Victoria.
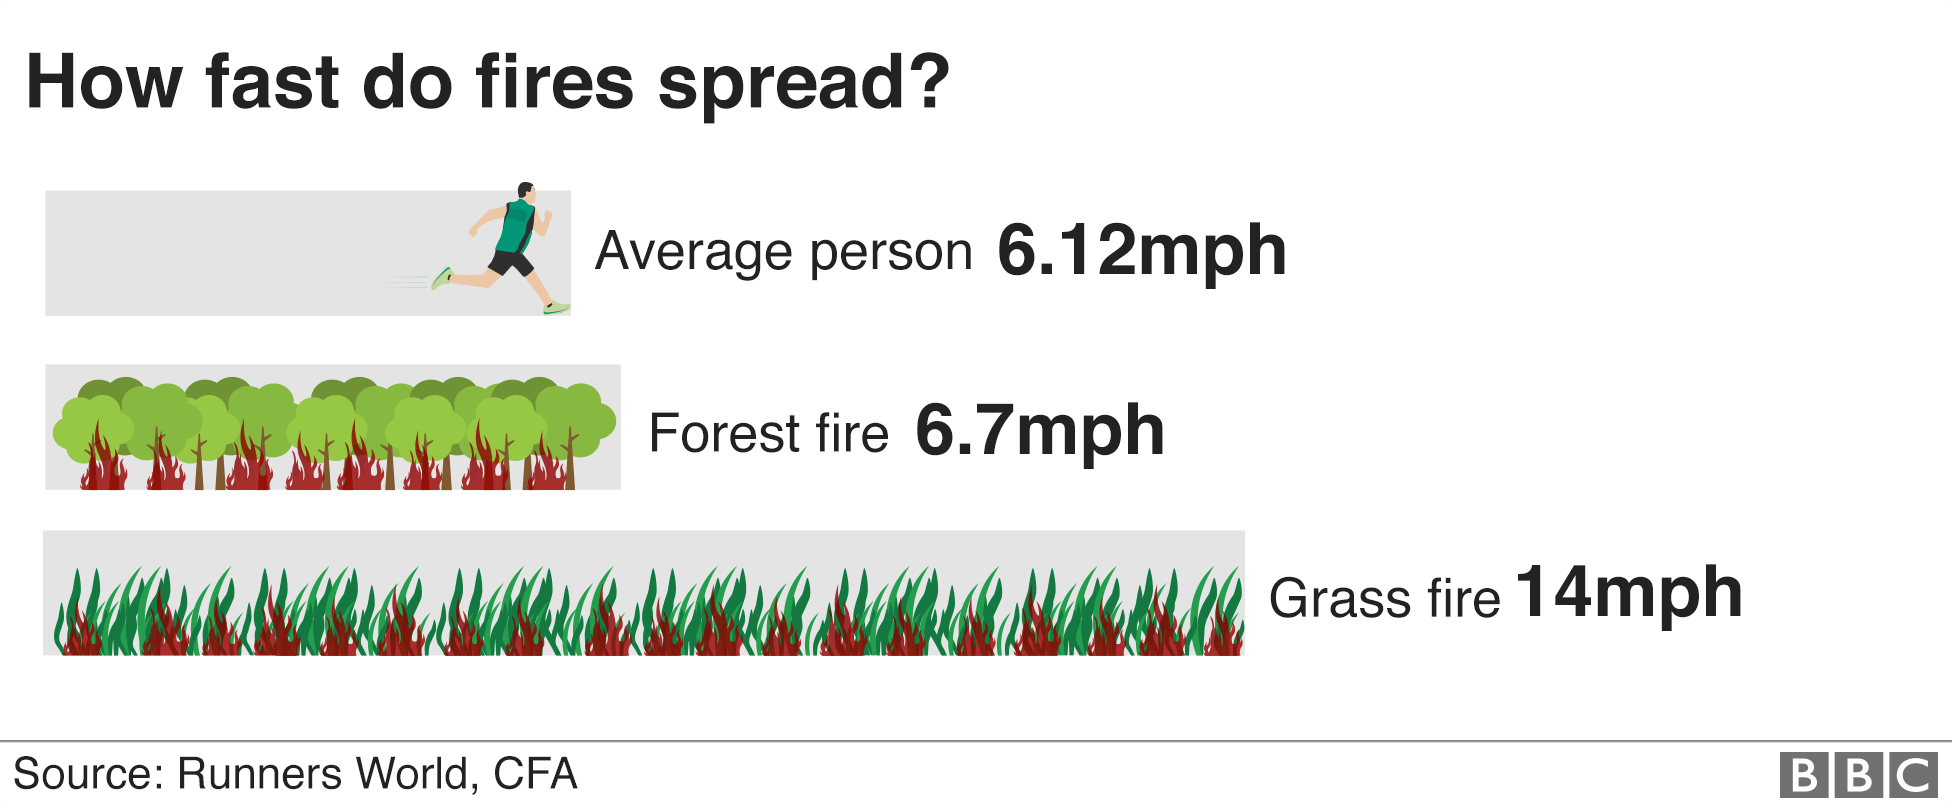
If there is a serious risk of fire reaching homes or properties, authorities urge people to leave in good time as fire can travel fast – faster than most people can run.
So is this down to climate change?
Many Australians are asking that very question – but the science is complicated.
Scientists have long warned that a hotter, drier climate will contribute to fires becoming more frequent and more intense. Many parts of Australia have been in drought conditions, some for years, which has made it easier for the fires to spread and grow.
Data shows that Australia has warmed overall by slightly more than one degree Celsius since 1910, with most of the heating occurring since 1950, the Bureau of Meteorology says.
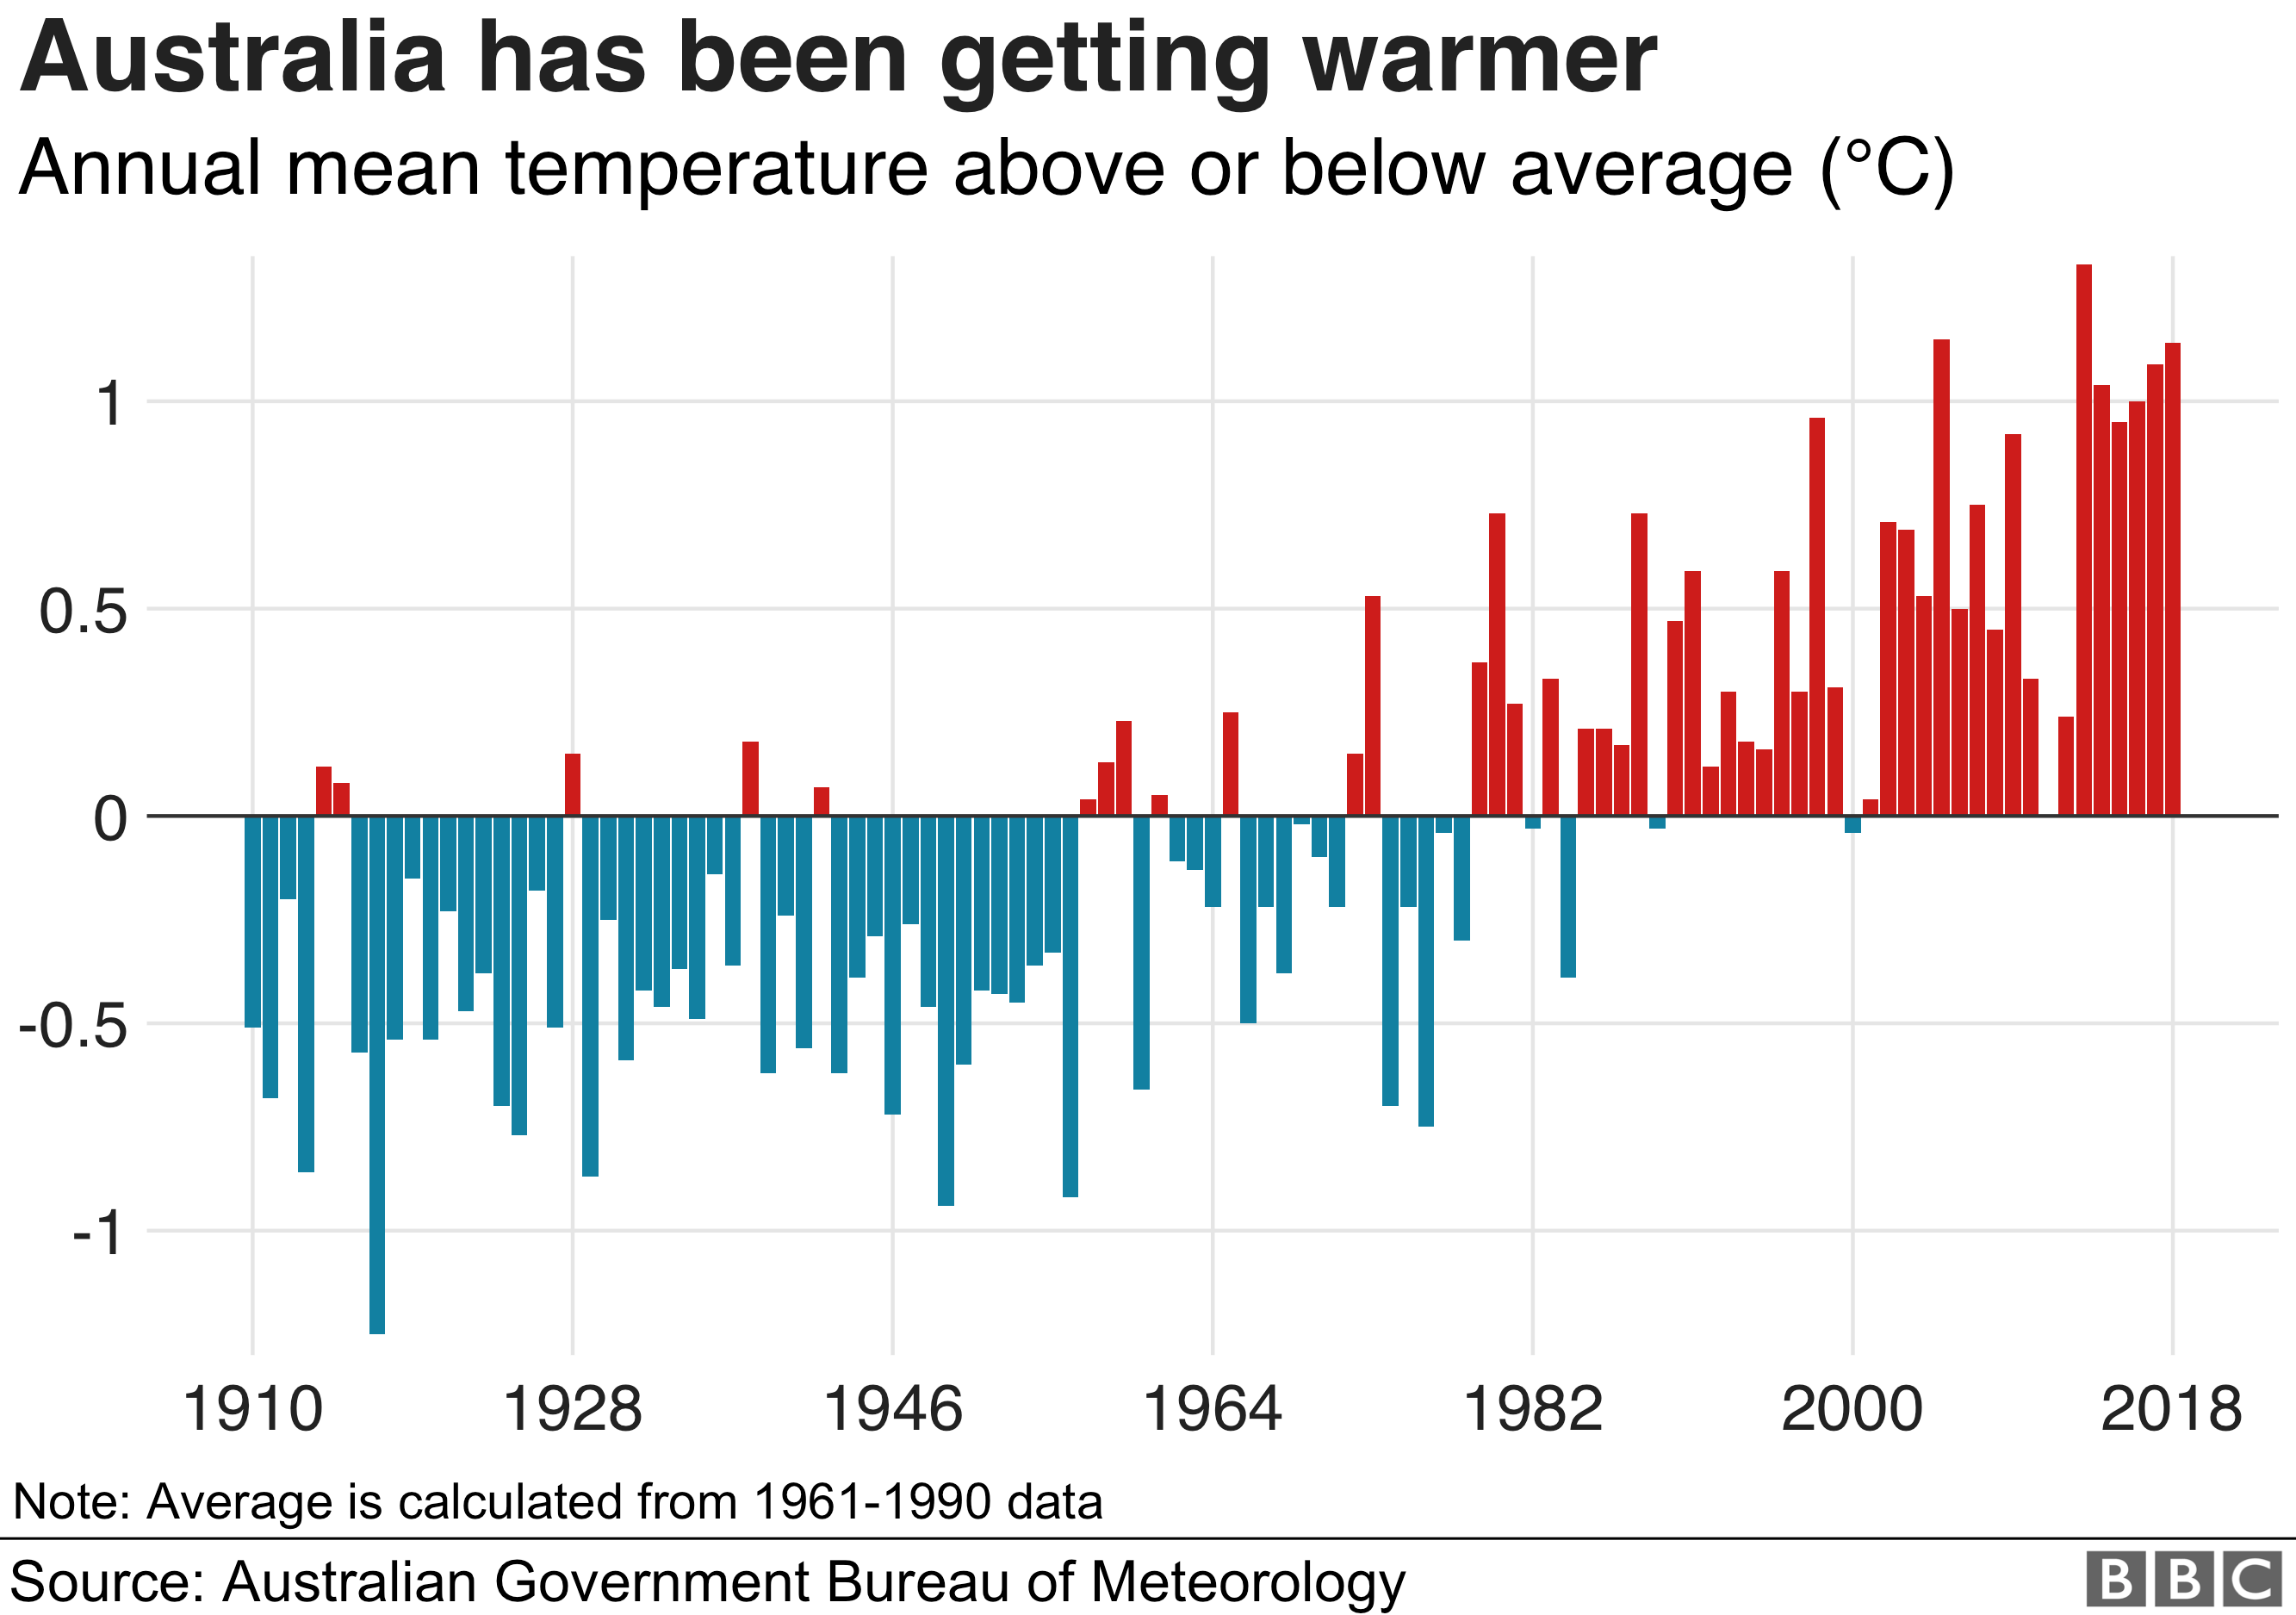
Australia broke its all-time temperature record twice in December. An average maximum of 40.9C was recorded on 17 December, broken a day later by 41.9C, both beating 2013’s record of 40.3C.
By the end of the month every state had measured temperatures above 40C – including Tasmania, which is usually much cooler than the mainland.

A climate phenomenon is causing the heatwave
The main climate driver behind the heat has been a positive Indian Ocean Dipole (IOD) – an event where sea surface temperatures are warmer in the western half of the ocean, cooler in the east.
The difference between the two temperatures is currently the strongest in 60 years.
As a result, there has been higher-than-average rainfall and floods in eastern Africa and droughts in south-east Asia and Australia.
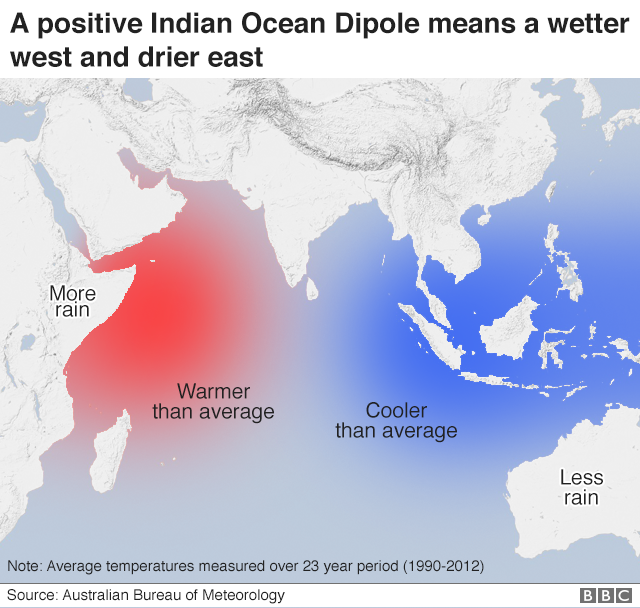
Andrew Watkins, head of long-range forecasts at the bureau, said the dipole was crucial to understanding the heatwave.
“The key culprit of our current and expected conditions is one of the strongest positive Indian Ocean dipole events on record,” he says.
“A positive IOD means we have cooler than average water pooling off Indonesia, and this means we see less rain-bearing weather systems, and warmer than average temperatures for large parts of the country.”
And meteorologists warn that, for the moment, the intense weather and elevated fire risk in Australia is set to continue.
Artikel ini telah tayang di bbc.com dengan judul “Australia fires: A visual guide to the bushfire crisis”, https://www.bbc.com/news/world-australia-50951043
Penulis : bbc
Foto Cover : bbc documentation